Quality management report
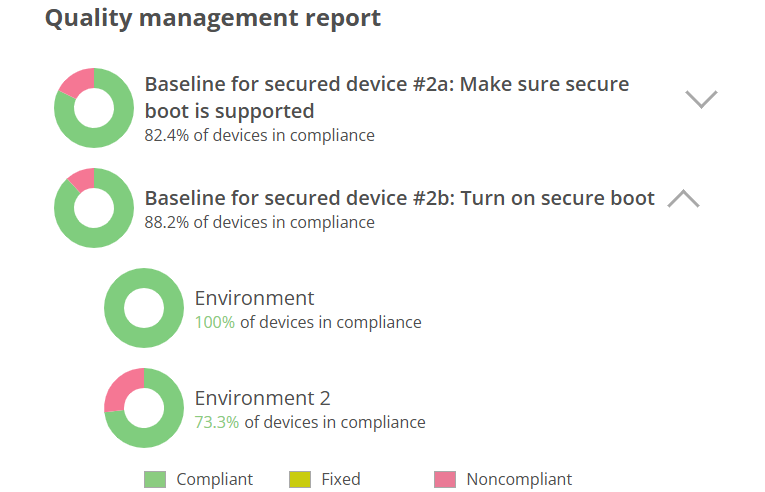
Quality management report is in the report view of the board. Report lists on separate lines board rules and a pie chart representation of the compliance level of devices. Pie chart shows how many percent of the devices are compliant with the rule and how many are not.
There are three sectors in the pie chart:
- Noncompliant, devices that are in some work item related to rule that is in any other state than done.
- Fixed, devices that are in some work item related to rule that is in the state done.
- Compliant, devices that don't appear in any work item related to rule.
If there are multiple environments under board then all environments with their data are shown separately under the rule. Environment breakdown can be opened from the ribbon after the rule name.
Quality management report is visible for users with role 'Report viewer' or above. Users with 'Report viewer' role can only see report not the board view.